Hello,
I installed Pydio Cells on a shared host (CentOS 7). Among other things, the hosting company enforces a limit of 300 Threads per user.
Despite Pydio Cells running fine, I can’t login via ssh any more, because bash is unable to start because of the limit:
-bash-4.2$ ll
-bash: fork: retry: No child processes
-bash: fork: retry: No child processes
-bash: fork: retry: No child processes
♥
-bash: fork: retry: No child processes
-bash: fork: Resource temporarily unavailable
What can I do about this problem?
Kind regards
charles
September 9, 2019, 4:08pm
2
wow, that’s interesting. you could be able to reduce the number of cells fork, but not sure it will change anything to the number of threads.@zayn could you try to set this limitation on a test vm ?
zayn
September 10, 2019, 12:02pm
3
Hello @zalintyre ,
Could you run the following command and tell me the number of threads that your machine has,ps -aux | wc -l.
Also do you know your machine hardware ? (lscpu to check the cpu count)
I"ve tried to reproduce your case by limiting the number of threads of my vm with echo 300 > /proc/sys/kernel/threads-max.
I had Cells Up and running with the database on the same server.
Does your Cells instance have lots of datasource?
$ ps -aux | wc -l
19
But from htop, I can see that each of the cells processes spawns about 25 threads. That seems quite many
$ lscpu
Architecture:          x86_64
CPU op-mode(s):        32-bit, 64-bit
Byte Order:            Little Endian
CPU(s):                20
On-line CPU(s) list:   0-19
Thread(s) per core:    1
Core(s) per socket:    1
Socket(s):             20
NUMA node(s):          1
Vendor ID:             GenuineIntel
CPU family:            6
Model:                 94
Model name:            Intel Core Processor (Skylake, IBRS)
Stepping:              3
CPU MHz:               2199.998
BogoMIPS:              4399.99
Hypervisor vendor:     KVM
Virtualization type:   full
L1d cache:             32K
L1i cache:             32K
L2 cache:              4096K
NUMA node0 CPU(s):     0-19
Flags:                 fpu vme de pse tsc msr pae mce cx8 apic sep mtrr pge mca cmov pat pse36 clflush mmx fxsr sse sse2 ss syscall nx pdpe1gb rdtscp lm constant_tsc rep_good nopl eagerfpu pni pclmulqdq ssse3 fma cx16 pcid sse4_1 sse4_2 x2apic movbe popcnt tsc_deadline_timer aes xsave avx f16c rdrand hypervisor lahf_lm abm 3dnowprefetch ibrs ibpb stibp fsgsbase bmi1 hle avx2 smep bmi2 erms invpcid rtm rdseed adx smap xsaveopt spec_ctrl intel_stibp
Pydio has one storage on the local SSD and a MySQL database, that’s it.
I start pydio cells using “supervisord”. Might it be case that pydio cells starts daemon processes that supervisord is not able to catch up with?
zayn
November 1, 2019, 8:18am
6
Hello @zalintyre ,
do you mind show me your supervisord config?
Global supervisord config:
$ cat /etc/supervisord.conf
# supervisord config for each user's supervisord instance.

[unix_http_server]
file=/run/supervisord/%(ENV_USER)s/supervisor.sock
username = dummy
password = dummy

[supervisorctl]
serverurl=unix:///run/supervisord/%(ENV_USER)s/supervisor.sock
username = dummy
password = dummy

[rpcinterface:supervisor]
supervisor.rpcinterface_factory = supervisor.rpcinterface:make_main_rpcinterface

[supervisord]
logfile=%(ENV_HOME)s/logs/supervisord.log
logfile_maxbytes=20MB
logfile_backups=3
loglevel=debug
pidfile=/dev/null
childlogdir=%(ENV_HOME)s/tmp
directory=%(ENV_HOME)s
identifier=supervisor_%(ENV_USER)s
nodaemon=true
strip_ansi=true
environment=PATH="/home/%(ENV_USER)s/bin:/home/%(ENV_USER)s/.local/bin:/opt/uberspace/etc/%(ENV_USER)s/binpaths/ruby:%(ENV_PATH)s"

[include]
files = %(ENV_HOME)s/etc/services.d/*.ini
In my user account:
$ cat ~/etc/services.d/pydio.ini
[program:pydio]
command=/home/orous/bin/tini -vvv -g -s -- /home/orous/bin/cells start
autostart=yes
autorestart=no
I tried with autorestart=yes, makes no difference. I added tini because I thought it would reap zombie processes if necessary, doesn’t make a difference either.
zayn
November 1, 2019, 2:50pm
8
That doesn’t work either. After supervisorctl stop pydio the processes detach and are re-parented to the init process. Also, every process keeps spawning 25 threads.
Same behavior with cells 2.0. Starts an endless number of threads that get re-parented when the parent process is killed.
zayn
November 19, 2019, 3:29pm
11
Could you please run ps aux | grep cells and then paste the result here, make sure to reproduce the case where you are thread limited.
$ ps -aux | grep cells
orous    20121 56.2  1.3 3088380 384976 ?      Sl   20:42   0:16 /home/orous/bin/cells start
orous    20208 13.5  0.5 1309500 168388 ?      Sl   20:42   0:02 /home/orous/bin/cells start --fork --registry nats --registry_address :4222 --registry_cluster_address :5222 --registry_cluster_routes  --broker nats --broker_address :4222 pydio.grpc.search
orous    20211 13.9  0.5 1293300 169732 ?      Sl   20:42   0:02 /home/orous/bin/cells start --fork --registry nats --registry_address :4222 --registry_cluster_address :5222 --registry_cluster_routes  --broker nats --broker_address :4222 pydio.gateway.websocket
orous    20212 14.3  0.5 1161716 168332 ?      Sl   20:42   0:02 /home/orous/bin/cells start --fork --registry nats --registry_address :4222 --registry_cluster_address :5222 --registry_cluster_routes  --broker nats --broker_address :4222 pydio.grpc.tasks
orous    20215 12.6  0.5 1284760 170588 ?      Sl   20:42   0:02 /home/orous/bin/cells start --fork --registry nats --registry_address :4222 --registry_cluster_address :5222 --registry_cluster_routes  --broker nats --broker_address :4222 pydio.grpc.jobs
orous    20287 14.4  0.5 1612816 167764 ?      Sl   20:42   0:02 /home/orous/bin/cells start --fork --registry nats --registry_address :4222 --registry_cluster_address :5222 --registry_cluster_routes  --broker nats --broker_address :4222 pydio.grpc.data.objects.local1
orous    20288 15.1  0.5 1154096 169700 ?      Sl   20:42   0:03 /home/orous/bin/cells start --fork --registry nats --registry_address :4222 --registry_cluster_address :5222 --registry_cluster_routes  --broker nats --broker_address :4222 pydio.grpc.data.sync.cellsdata
orous    20289 15.8  0.5 1481744 168344 ?      Sl   20:42   0:03 /home/orous/bin/cells start --fork --registry nats --registry_address :4222 --registry_cluster_address :5222 --registry_cluster_routes  --broker nats --broker_address :4222 pydio.grpc.data.sync.personal
orous    20290 14.0  0.5 1022192 170368 ?      Sl   20:42   0:02 /home/orous/bin/cells start --fork --registry nats --registry_address :4222 --registry_cluster_address :5222 --registry_cluster_routes  --broker nats --broker_address :4222 pydio.grpc.data.sync.pydiods1
orous    20431 15.3  0.5 1440444 163404 ?      Sl   20:42   0:02 /home/orous/bin/cells start --fork --registry nats --registry_address :4222 --registry_cluster_address :5222 --registry_cluster_routes  --broker nats --broker_address :4222 pydio.grpc.data.index.personal
orous    20432 13.8  0.5 1219056 167888 ?      Sl   20:42   0:02 /home/orous/bin/cells start --fork --registry nats --registry_address :4222 --registry_cluster_address :5222 --registry_cluster_routes  --broker nats --broker_address :4222 pydio.grpc.data.index.pydiods1
orous    20433 13.5  0.5 1022192 168808 ?      Sl   20:42   0:02 /home/orous/bin/cells start --fork --registry nats --registry_address :4222 --registry_cluster_address :5222 --registry_cluster_routes  --broker nats --broker_address :4222 pydio.grpc.data.index.cellsdata
zayn
November 25, 2019, 8:37am
13
Hello,
Can you try with this command ps -efL | grep cells | wc -l (it will list all the cells threads and count the lines)
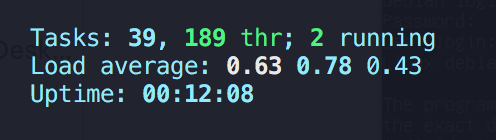
also on HTOP if you hit shift + h it should display all threads could you tell me the total count (see screenshot)
in my case I have 189 threads
Hi,
sorry for the wait!
$ ps -efL | grep cells | wc -l
300
Cells already hit 300 threads from the start.
Tasks: 17, 340 thr; 1 running
Load average: 1.61 1.87 1.83
Uptime: 29 days, 09:09:22