dam09fr
November 15, 2020, 4:47pm
1
Hello here,
Yesterday I got a warning from NetData on my server, telling me that tcp_mem was high on usage.
No special load on the server, so I restart Cells docker container and saw that the usage go down to ~zero
Today, I checked my server again and saw that the usage is constantly climbing again, as yesterday, a restart of the container downed it to ~zero:
Some things to notice:
my Cells instance is very slow to start some services (server is enough big, but no SSD), but after start no slowness
after some days, Cells is unusable without restart (nothing after log, just a waiting screen, nothing in the logs)
Some informations on my instance:
Cells : 2.1.6 (Home Edition)
OS: Debian 10 x64
Docker: 19.03.13
Database: 10.3.27-MariaDB
Reverse proxy: HAproxy 2.0.19
Server: Intel Xeon W3520 (4c/8t) + 16Go DDR3 ECC + 2x SATA 2To Raid1
Can you help me please ?
dam09fr
November 27, 2020, 8:22pm
2
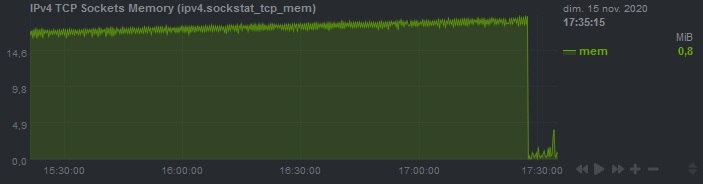
Hello, after 12 days running Cells, my tcp_mem usage is now again very high:
I run some tests before taking any actions on the server:
# cat /proc/sys/net/ipv4/tcp_mem
190734  254315  381468

# cat /proc/net/sockstat
sockets: used 399
TCP: inuse 35 orphan 0 tw 71 alloc 435 mem 199462
UDP: inuse 4 mem 3
UDPLITE: inuse 0
RAW: inuse 0
FRAG: inuse 0 memory 0

# ss -s
Total: 401
TCP:   447 (estab 13, closed 401, orphaned 2, timewait 10)

Transport Total     IP        IPv6
RAW       0         0         0
UDP       6         4         2
TCP       46        37        9
INET      52        41        11
FRAG      0         0         0

# free -m
              total        used        free      shared  buff/cache   available
Mem:          16031        7773         452         248        7805        8031
Swap:         32765         740       32025

# top (no user connected)
  PID USER      PR  NI    VIRT    RES    SHR S  %CPU  %MEM     TIME+ COMMAND
 4760 root      20   0 5651228 270176  21024 S  11.3   1.6   1664:04 cells
 4809 root      20   0 1897976  68364  14124 S   5.3   0.4 759:04.31 cells
 4813 root      20   0 1898168  52704  12824 S   4.6   0.3 659:54.88 cells
 4889 root      20   0 1897528  46268   8224 S   3.0   0.3 328:13.56 cells
 4862 root      20   0 1897976  48744  11216 S   2.6   0.3 521:37.57 cells
 5068 root      20   0 1823860  42684  12584 S   2.3   0.3 143:51.51 cells
And the same tests after restarting the cells container:
# docker restart cells

# cat /proc/sys/net/ipv4/tcp_mem
190734  254315  381468

# cat /proc/net/sockstat
sockets: used 402
TCP: inuse 36 orphan 0 tw 11 alloc 220 mem 235
UDP: inuse 4 mem 3
UDPLITE: inuse 0
RAW: inuse 0
FRAG: inuse 0 memory 0

# ss -s
Total: 406
TCP:   241 (estab 15, closed 194, orphaned 1, timewait 8)

Transport Total     IP        IPv6
RAW       0         0         0
UDP       6         4         2
TCP       47        38        9
INET      53        42        11
FRAG      0         0         0

# free -m
              total        used        free      shared  buff/cache   available
Mem:          16031        5748        2344         248        7938       10008
Swap:         32765         715       32050

# top (no user connected)
  PID USER      PR  NI    VIRT    RES    SHR S  %CPU  %MEM     TIME+ COMMAND
22685 root      20   0 5081264 326700 138704 S   3.0   2.0   0:17.14 cells
22810 root      20   0 1750064  92884  61888 S   2.0   0.6   0:03.95 cells
22807 root      20   0 1750064  93516  61340 S   1.7   0.6   0:03.97 cells
22757 root      20   0 1750064  90120  60340 S   1.3   0.5   0:04.27 cells
22761 root      20   0 6952044 262840 231464 S   1.3   1.6   0:03.96 cells
22806 root      20   0 1750064  91716  61392 S   1.0   0.6   0:04.00 cells
22754 root      20   0 1528100  89432  60496 S   0.7   0.5   0:01.77 cells
22827 root      20   0 1676268  95844  56772 S   0.7   0.6   0:02.78 cells
After restart, I can see tcp_mem dropped down from 778MB to 0.2MB:
Do you have any suggestions to help me understanding what is going on ?
bsinou
December 2, 2020, 7:23am
3
This has been one of the main focus we had when working on the next 2.2.0 version and we hope we have solve most of the glitches that were causing this behaviour.
We are slowly entering the staging phase for the v2.2 and hope to be able to release it soon.
Thank you for your answer.
bsinou
December 4, 2020, 8:30am
5
If you have a staging environment we pushed yesterday a RC1 version. It is NOT yet production ready but you might have a look to see if it behaves better.
We would be very glad to have feedback on this before the release.
Sure, I can do some tests, is it the “pre-release” tag on Docker Hub ?
bsinou
December 8, 2020, 7:34am
7
yes, exactly. We push this tag on the hub during the pre-release phase… But warning with this, it might be overwritten without warning


 when we are ready for the next round